Methodist Le Bonheur
Real-time tools for running five hospitals
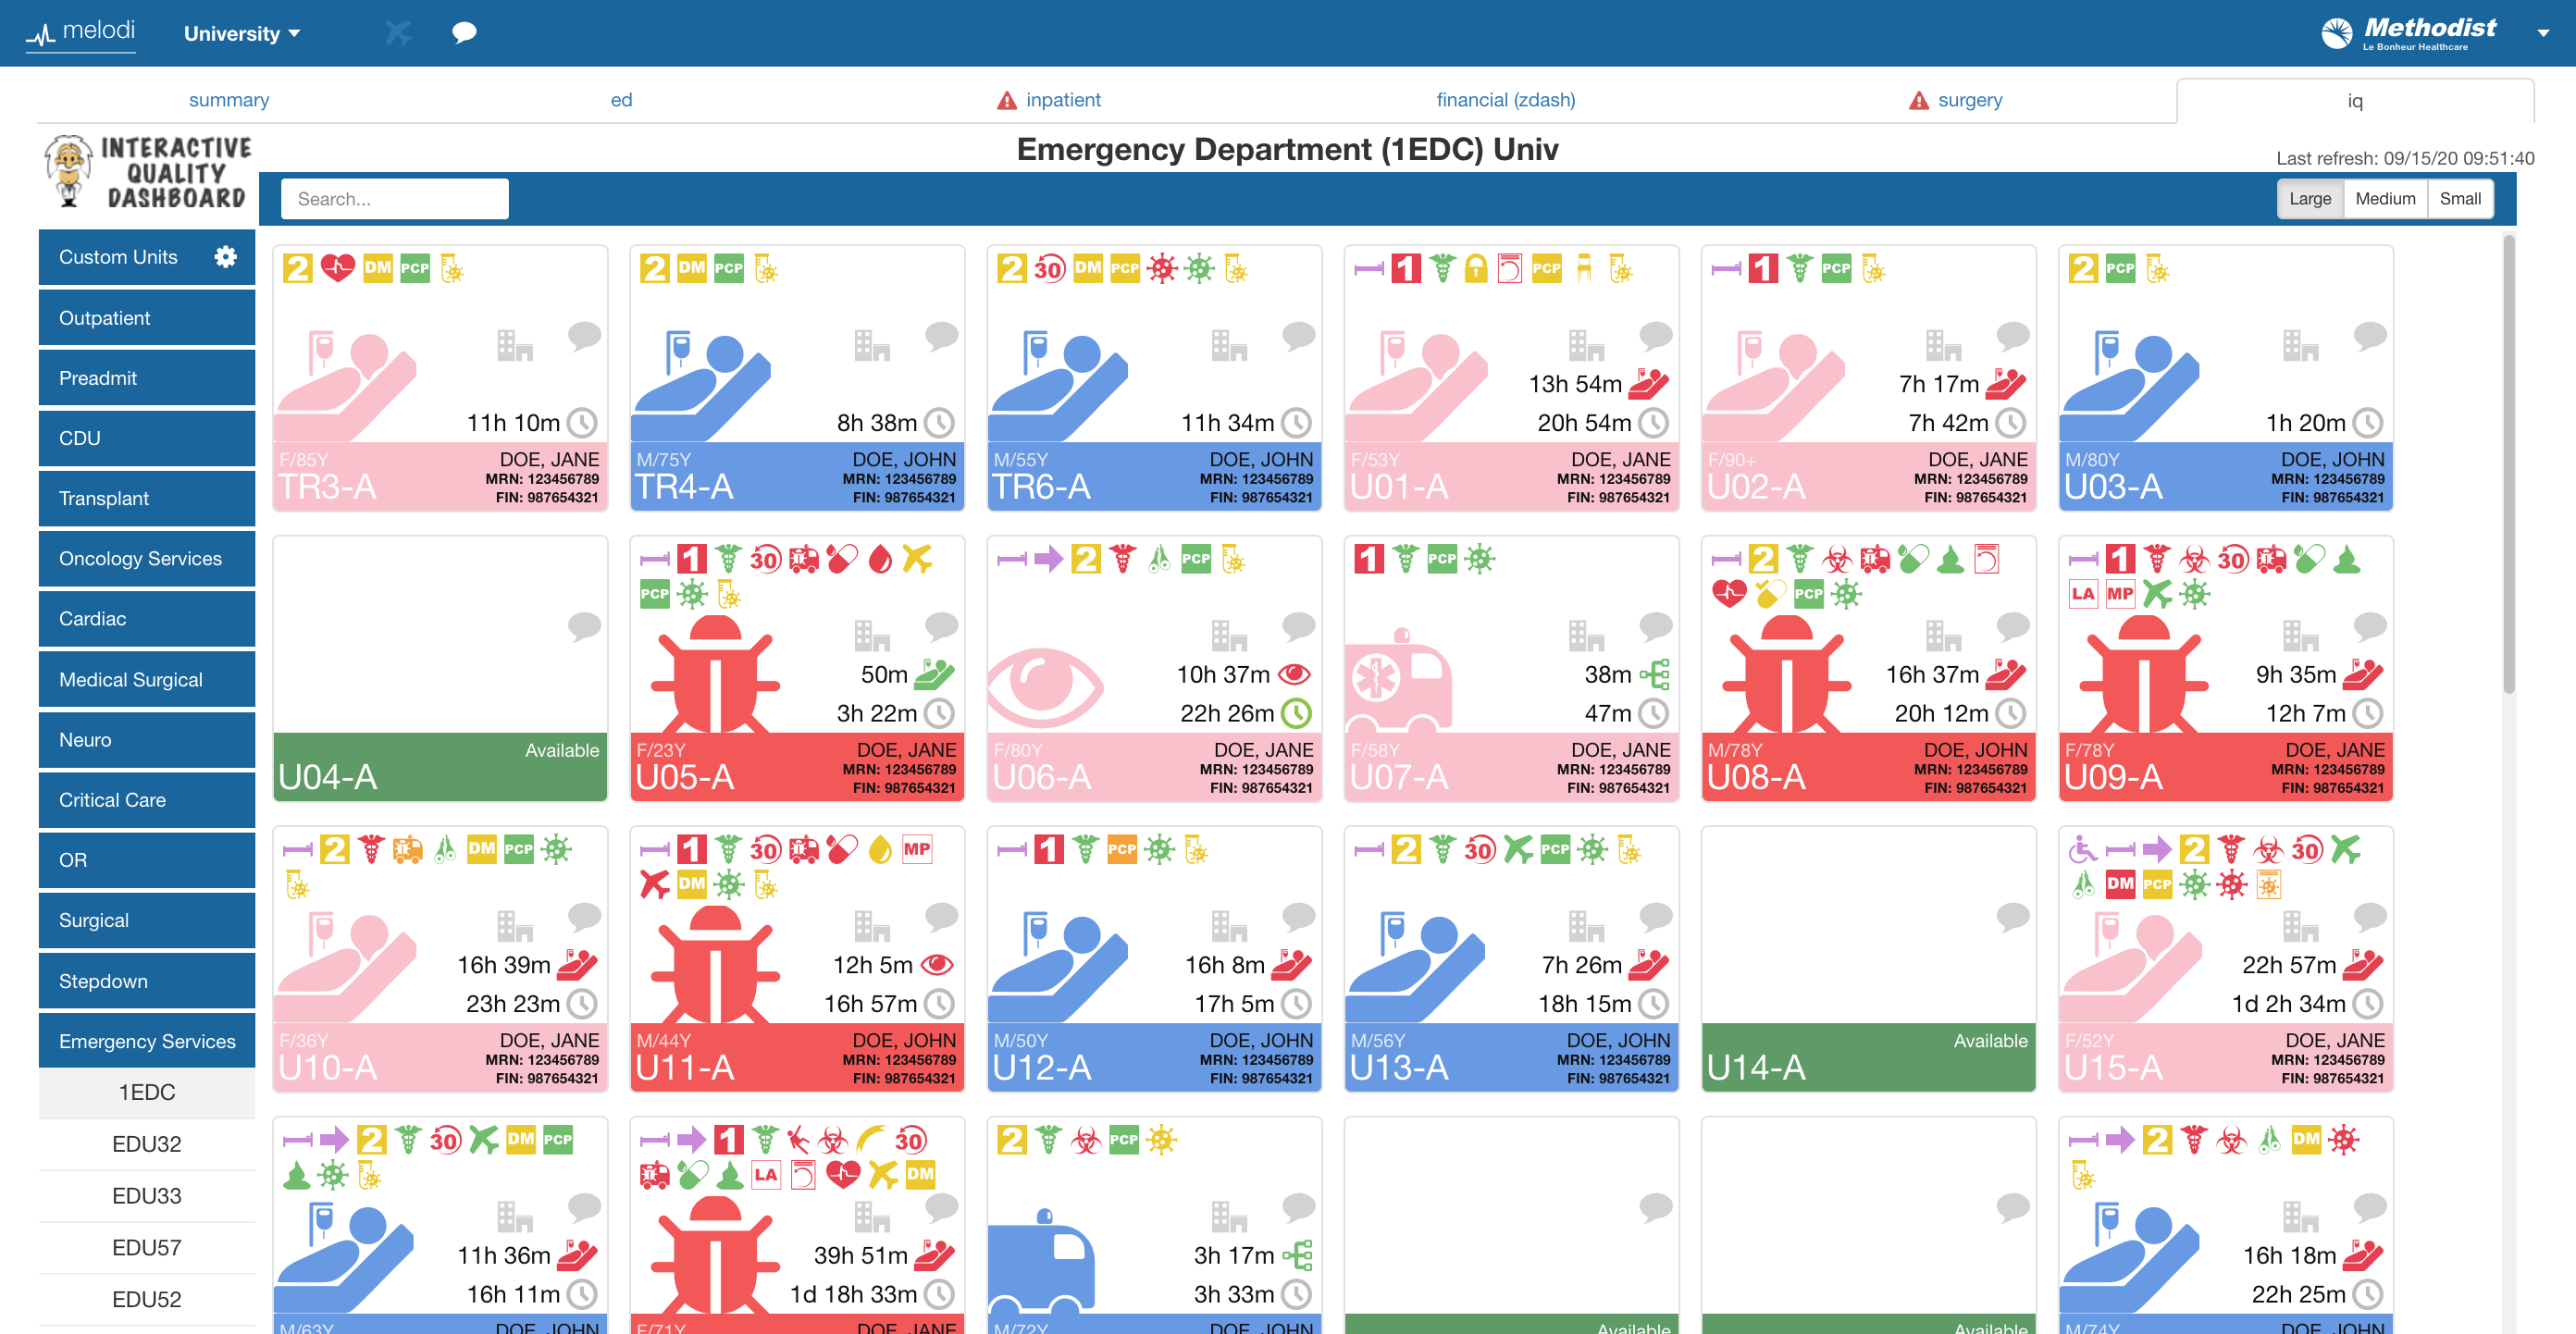
IQ Dashboard had 800 to 1,000 people using it at once, from charge nurses to corporate SVPs.
- My role
- Solutions Architect II
- Years
- 2014–2021
- Team
- Innovation Team
- Built for
- Methodist Le Bonheur Healthcare’s five hospitals
- Platforms
- Web, iPad, touchscreen whiteboards
- Built with
- Node, GraphQL and Vue (Flow), Swift (iPad apps), Backbone.js, Laravel and SQL Server (Melodi)
The problem
Critical data was spread across disconnected systems: financials, the EHR, custom applications, even whiteboards. Nothing pulled it together to show what was happening across the hospitals right now in a single view.
What we built
A connected set of web and mobile tools that turned fragmented hospital data into a shared view of beds, patients, care teams, and goals. The team built two kinds of data pipelines from the Cerner EHR: scheduled file feeds for dashboards like IQ Dashboard, and a custom set of REST APIs for the real-time tools, which pulled clinical data on demand without storing more than necessary. On top of those, we built:
- Flow: patient flow for all five hospitals, with bed management, environmental services, and patient transport sharing live data. The Integrated Operations Center and house supervisors reserved beds for waiting patients, and the reservations appeared on IQ Dashboard. Environmental services attendants cleaned beds from iPads on their carts, and transport dispatchers assigned patient moves from a dispatch board.
- IQ Dashboard: the bed board in Melodi, the team’s operations portal, covering every nursing unit in every hospital and connected to Flow.
- Transplant suite: iPads outside patient rooms, touchscreen whiteboards inside them, and an assignment board that let care teams update both from any computer.1
- Administrative Rounding Tool: showed which patients needed visits, kept rounding history, and sent issues straight to environmental services and Maintenance.
- Physician web apps: PathPortal let oncology physicians track pathology samples and save finished reports as PDFs for their own EMR. Mobile Clinical Summary was a mobile chart view that also sent sepsis alerts to physicians.
- Operational dashboards: for the Integrated Operations Center, flow leaders, and nursing huddles.
Flow’s Bed Control, matching waiting patients to open beds
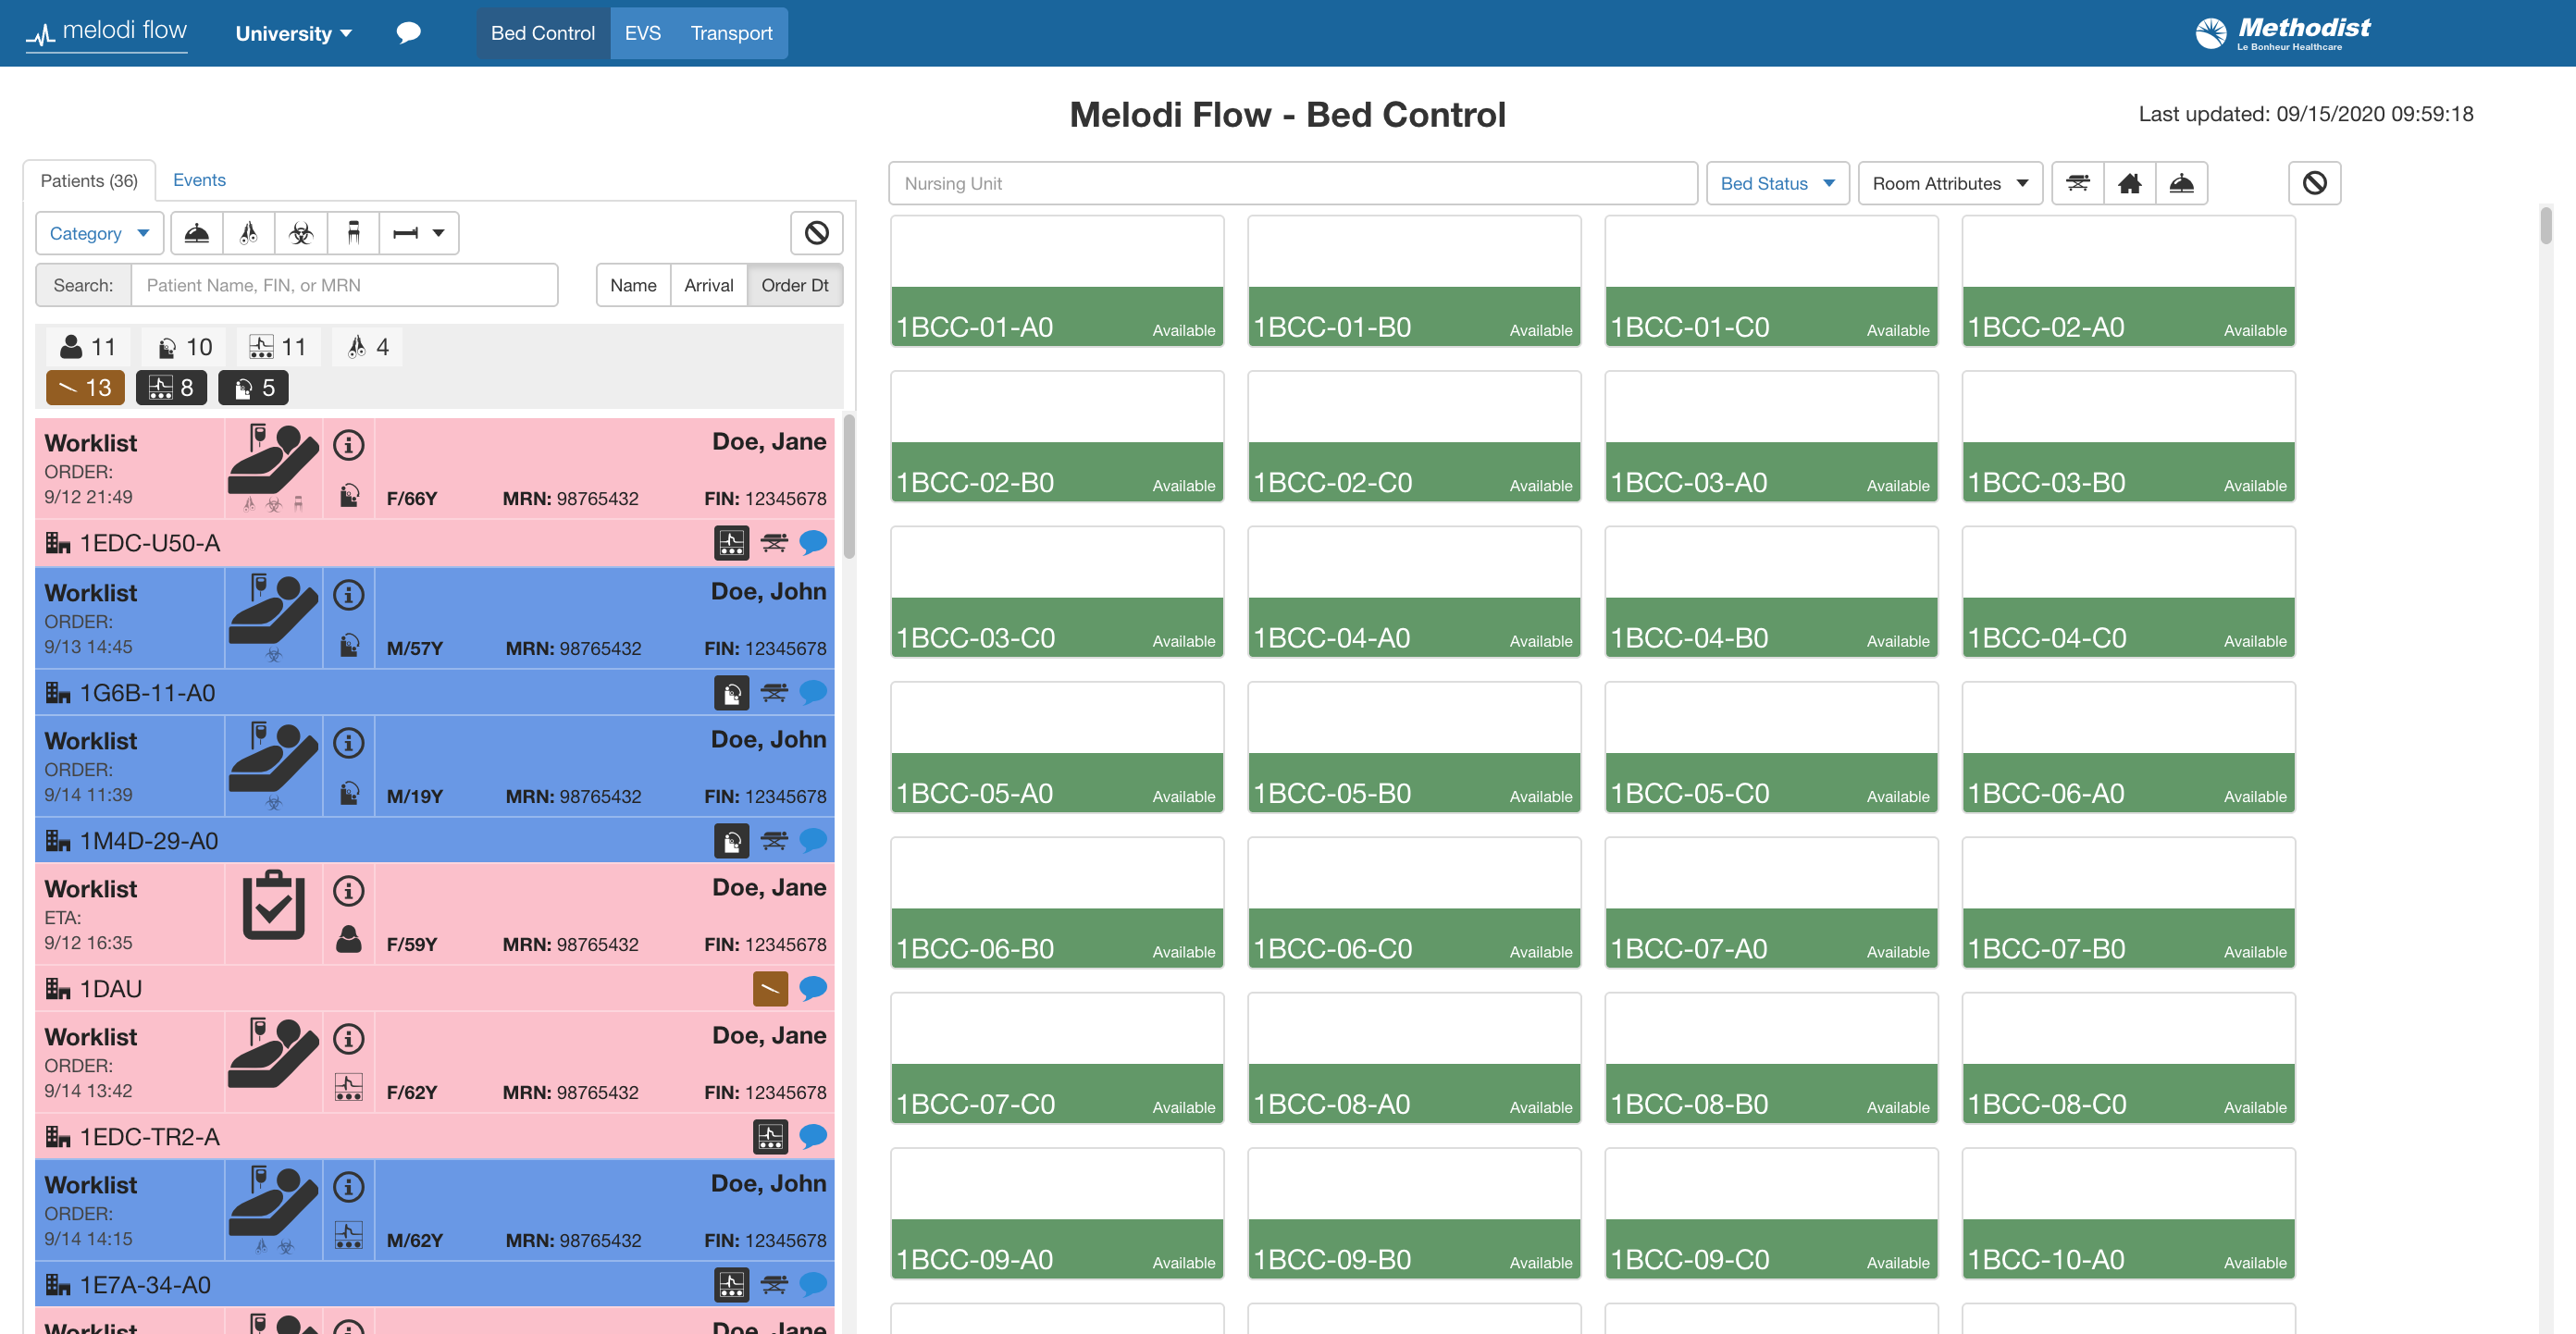
Screens show test patients.
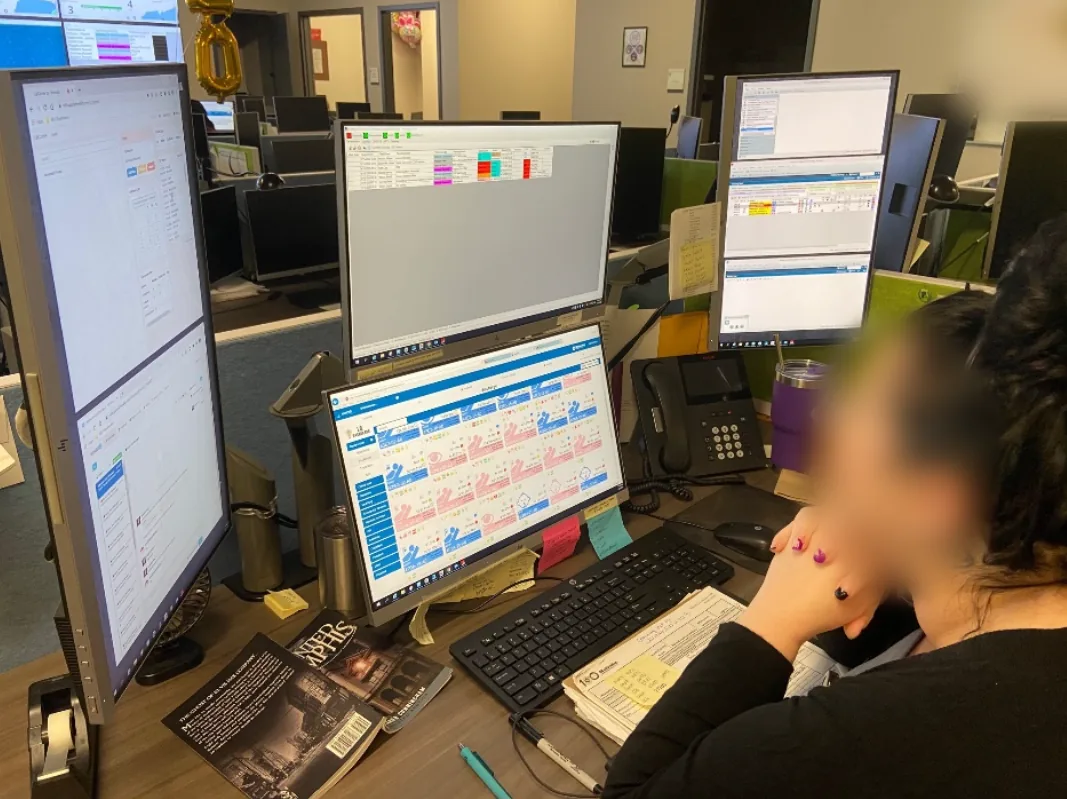
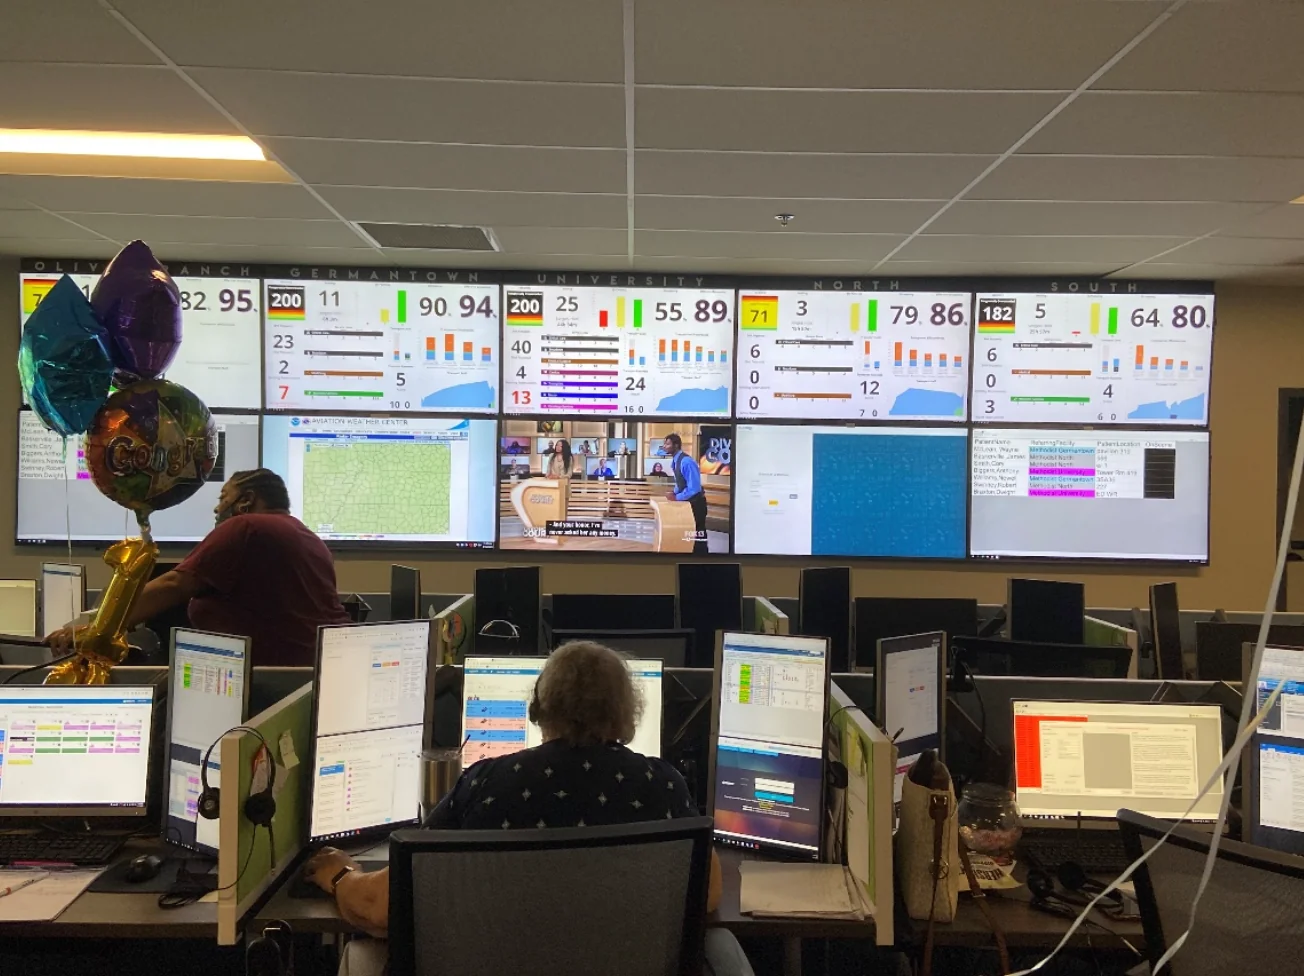
In use, at a desk and in the Integrated Operations Center
My part
What I did
- Met with each department to learn how they worked.
- Proposed solutions, then designed the interfaces and interactions.
- Designed the visual system for Melodi and IQ Dashboard, and refined the user experience across the portal.
- Designed, co-built, and took Flow to production across all five hospitals.
- Built the Transplant Institute room-status iPads, the Administrative Rounding Tool, PathPortal, and Mobile Clinical Summary.
- Refined everything from feedback, from discovery through delivery.
What others did
- The Innovation Team built the data pipelines from the Cerner EHR.
Results
- 800 to 1,000 people at once: IQ Dashboard was used by more roles than any other tool in the health system, from charge nurses to corporate SVPs.
- Backbone of the Integrated Operations Center: the IOC tracked patient flow across every adult hospital using our Flow and IQ Dashboard tools.
- Replaced paper and manual whiteboards: in Transplant, door signage, in-room whiteboards, and nursing assignment boards became connected digital tools that care teams could update from any computer, without waking the patient.
- Took manual work off staff: environmental services attendants claimed, started, and cleared dirty beds from iPads on their carts.
- Brought front-line nurses into quality work: nursing leaders used the Daily Operating System dashboard in daily huddles to turn system quality metrics into specific steps nurses could take.
Notes
- The Transplant suite was featured in the Memphis Commercial Appeal: Shorb Tower’s Transplant Institute has newest tech to help Methodist’s sickest patients (May 2019).